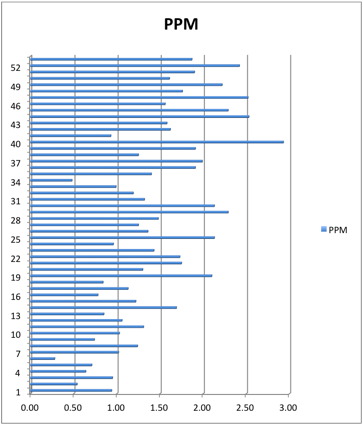
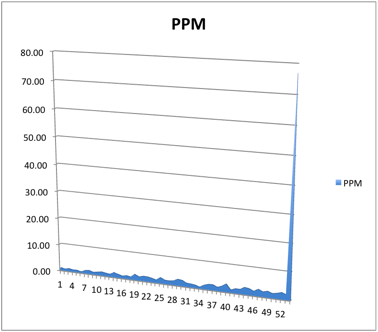
Monthly trends: in CO2 from NOAA
#
Decadal averages
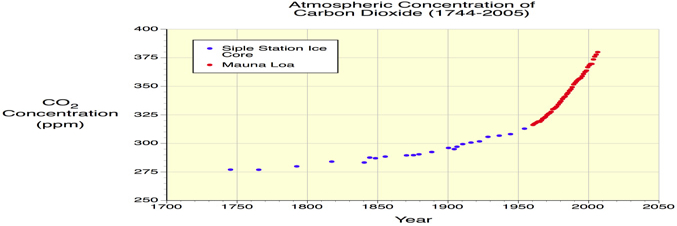
Judge for yourself: are we overheating the world because carbon dioxide traps heat (infra-red radiation):
| ppm/annum | Monthly trends: in CO2 from NOAA |
||||||||||
|
|||||||||||
| every year: | parts per million increases - growth |
|
|||||||||
# |
Year | PPM > | Total > | rate | |||||||
| 1 | 1959 | 0.94 | |||||||||
| 2 | 1960 | 0.54 |
|
||||||||
| 3 | 1961 | 0.95 | |||||||||
| 4 | 1962 | 0.64 | |||||||||
| 5 | 1963 | 0.71 | |||||||||
| 6 | 1964 | 0.28 | |||||||||
| 7 | 1965 | 1.02 | |||||||||
| 8 | 1966 | 1.24 | |||||||||
| 9 | 1967 | 0.74 | |||||||||
| 10 | 1968 | 1.03 | 0.81 | ||||||||
| 1 | 1969 | 1.31 | |||||||||
| 2 | 1970 | 1.06 | |||||||||
| 3 | 1971 | 0.85 | |||||||||
| 4 | 1972 | 1.69 | |||||||||
| 5 | 1973 | 1.22 | |||||||||
| 6 | 1974 | 0.78 | |||||||||
| 7 | 1975 | 1.13 | |||||||||
| 8 | 1976 | 0.84 | |||||||||
| 9 | 1977 | 2.10 | |||||||||
| 20 | 1978 | 1.30 | 1.23 | ,{1969-1978 average rate of increase of Carbon dioxide} | |||||||
| 1 | 1979 | 1.75 | |||||||||
| 2 | 1980 | 1.73 | |||||||||
| 3 | 1981 | 1.43 | |||||||||
| 4 | 1982 | 0.96 | |||||||||
| 5 | 1983 | 2.13 | |||||||||
| 6 | 1984 | 1.36 | |||||||||
| 7 | 1985 | 1.25 | |||||||||
| 8 | 1986 | 1.48 |
|
||||||||
| 9 | 1987 | 2.29 | |||||||||
| 30 | 1988 | 2.13 | 1.65 | ||||||||
| 1 | 1989 | 1.32 | |||||||||
| 2 | 1990 | 1.19 | |||||||||
| 3 | 1991 | 0.99 | |||||||||
| 4 | 1992 | 0.48 | |||||||||
| 5 | 1993 | 1.40 | |||||||||
| 6 | 1994 | 1.91 | |||||||||
| 7 | 1995 | 1.99 | |||||||||
| 8 | 1996 | 1.25 | |||||||||
| 9 | 1997 | 1.91 | |||||||||
| 40 | 1998 | 2.93 | 1.54 | ||||||||
| 1 | 1999 | 0.93 | |||||||||
| 2 | 2000 | 1.62 | |||||||||
| 3 | 2001 | 1.58 | |||||||||
| 4 | 2002 | 2.53 | |||||||||
| 5 | 2003 | 2.29 | |||||||||
| 6 | 2004 | 1.56 | |||||||||
| 7 | 2005 | 2.52 | |||||||||
| 8 | 2006 | 1.74 | |||||||||
| 9 | 2007 | 2.12 | |||||||||
| 50 | 2008 | 1.61 | 1.86 | , {1999-2008 average rate of increase of Carbon dioxide} | |||||||
| 1 | 2009 | 1.67 | |||||||||
| 2 | 2010 | 2.39 | |||||||||
| 3 | 2011 | 1.70 | |||||||||
| 4 | 2012 | 2.40 | |||||||||
| 5 | 2013 | 2.51 | |||||||||
| 6 | 2014 | 1.89 | 2.25 | , {2005-2016 average rate of increase of Carbon dioxide} | |||||||
| Levels: | Source: NOAA; daily, monthly and annual measures. | ||||||||||
| Amount | 2015 | 404.01 | May | ||||||||
| 2015 | 400.04 | November | 11–25–2015 | 400.81 | |||||||
| 2016 | 404.15 | January | 1-24-2016 | 404.15 | |||||||
| Current | 2016 | 405.42 | November | 11–25–2016 | 405.42 | ||||||
| December | 404.44 | 12-12-16 | |||||||||
| Source: | |||||||||||
| https://www.esrl.noaa.gov/gmd/ccgg/trends/monthly.html | |||||||||||
| NOAA-Mauna Loa site | |||||||||||
Why global warming is not a natural trend.
Archer | Christianson | Gelbspan | James Hansen, 04 : Hansen 06 | McKibben| Musil | Schmidt | Weart | Wigley